Half the Team, Double the Output
Why small teams of excellent people produce more output at lower cost than large teams of average performers... and the math behind it.
Walk into any budget planning meeting in corporate America and you’ll hear variations of the same question asked over and over: “How many heads do we need?” The CFO asks it while building next year’s operating plan. The VP of Operations asks it when proposing a new initiative. The Sales Director asks it when setting aggressive growth targets. It’s the lingua franca of resource planning, and underlying this ubiquitous question is an assumption so fundamental that almost no one bothers to examine it.
The assumption is this: work scales linearly with people. If you want twice the output, you need twice the people. If you want to double revenue, you need to double your sales team. If your customer support queue is overflowing, the answer is obvious - hire more support agents. If your engineering team can’t ship fast enough, clearly you need more engineers. This seems not just logical but self-evident. It’s how we think about almost every other input in business, after all. Double your raw materials and you double your output. Double your ad spend and you roughly double your leads. More input equals more output. Simple math.
Except when it comes to people, this math is completely, fundamentally wrong.
The research on this is actually remarkably clear, and the operational reality is undeniable once you start looking for it, but somehow most organizations continue to operate as if all employees are interchangeable units of productivity. They budget as if the difference between their best performer and their worst performer is maybe 20-30%, when the reality is often closer to 300-500%. They plan headcount as if adding a tenth person to a team will contribute one-tenth of the team’s total output, ignoring the exponentially growing coordination costs that come with each additional body. They treat people like they treat office space or software licenses - a cost to be optimized on a per-unit basis, rather than recognizing that the variance in return on investment between a great hire and a mediocre hire is larger than almost any other business decision they’ll make all year.
Here’s the insight that changes everything, the one that makes talented operators look like magicians while their peers struggle: the highest ROI move in people management is usually not hiring more people. It’s upgrading the people you already have - even if that means fewer total headcount. This isn’t intuitive. In fact, it contradicts almost everything managers are taught about capacity planning and resource allocation. It feels wrong when you first hear it, almost reckless. But once you see the math - really see it, not just acknowledge it intellectually - you can’t unsee it. And more importantly, you can’t keep managing the same way.
The Model: Understanding Talent Density
The Traditional (Wrong) Assumption
Let’s start by making explicit what most organizations believe implicitly, even if they’d never quite articulate it this way. The mental model that governs budget planning, hiring decisions, and capacity discussions in most companies looks something like this:
Total Output = Number of People × Average Productivity per Person
It’s clean. It’s linear. It’s wrong. But it’s also comforting in its simplicity, which is probably why it persists despite mountains of evidence to the contrary. If you need 20% more output, you hire 20% more people. If you need to cut costs by 15%, you reduce headcount by 15%. The equation works both ways, and it makes financial modeling straightforward. HR can build their recruiting pipeline around it, Finance can project expenses with confidence, and everyone can have reasonable conversations about trade-offs because the math appears to work.
The problem is that this model treats people as if they were interchangeable commodities, like kilowatt-hours of electricity or gallons of diesel fuel. Feed more in, get proportionally more out. But human beings aren’t commodities, and their productivity isn’t uniform. Not even close.
The Reality: Non-Linear Dynamics
Here’s what the actual equation looks like when you account for how teams really function in the messy reality of organizational life:
Total Output = Σ(Individual Productivity) - Coordination Costs
Where:
Σ(Individual Productivity) = Sum of what each person produces (not an average!)
Coordination Costs = Overhead of people working together (grows exponentially)
Now, at first glance this might seem like a minor tweak, just a bit more precision added to essentially the same model. But embedded in this revised equation are two insights that completely transform how you should think about building and managing teams. Let me unpack both of them, because understanding these two dynamics is the key to unlocking the Talent Density Multiplier.
The First Dynamic: Productivity Distribution
The first insight is that “average productivity” is a statistical fiction that obscures massive variance. When you actually measure individual output - and I mean really measure it rigorously, not just rely on annual performance reviews or manager intuition - what you discover is that the spread between your best performers and your worst performers is shockingly large. We’re not talking about 20% or 30% differences. We’re talking about multiples.
The research on this goes back decades and has been replicated across virtually every industry and job function you can imagine. Back in 1968, researchers named Sackman, Erickson, and Grant published a landmark study that looked at programmer productivity. What they found was that the top 10% of engineers were five to ten times more productive than average programmers - not 50% more productive, not twice as productive, but five to ten times. That study focused on software engineering, which everyone assumed was a special case, an outlier, the kind of knowledge work where individual brilliance could create disproportionate value. But then researchers started looking at other fields, and the pattern held everywhere.
The productivity variance across industries:
Software engineering: Top 10% are 5-10x more productive than average
Sales: Top 20% generate 50-80% of total revenue
Manufacturing: Best operators have 40-60% fewer defects, 30-40% higher throughput
Customer service: Top performers resolve 3x more cases with higher satisfaction scores
The pattern is universal: in every role, in every industry, productivity variance is massive, and yet most companies systematically ignore it when making decisions about hiring, compensation, and team structure.
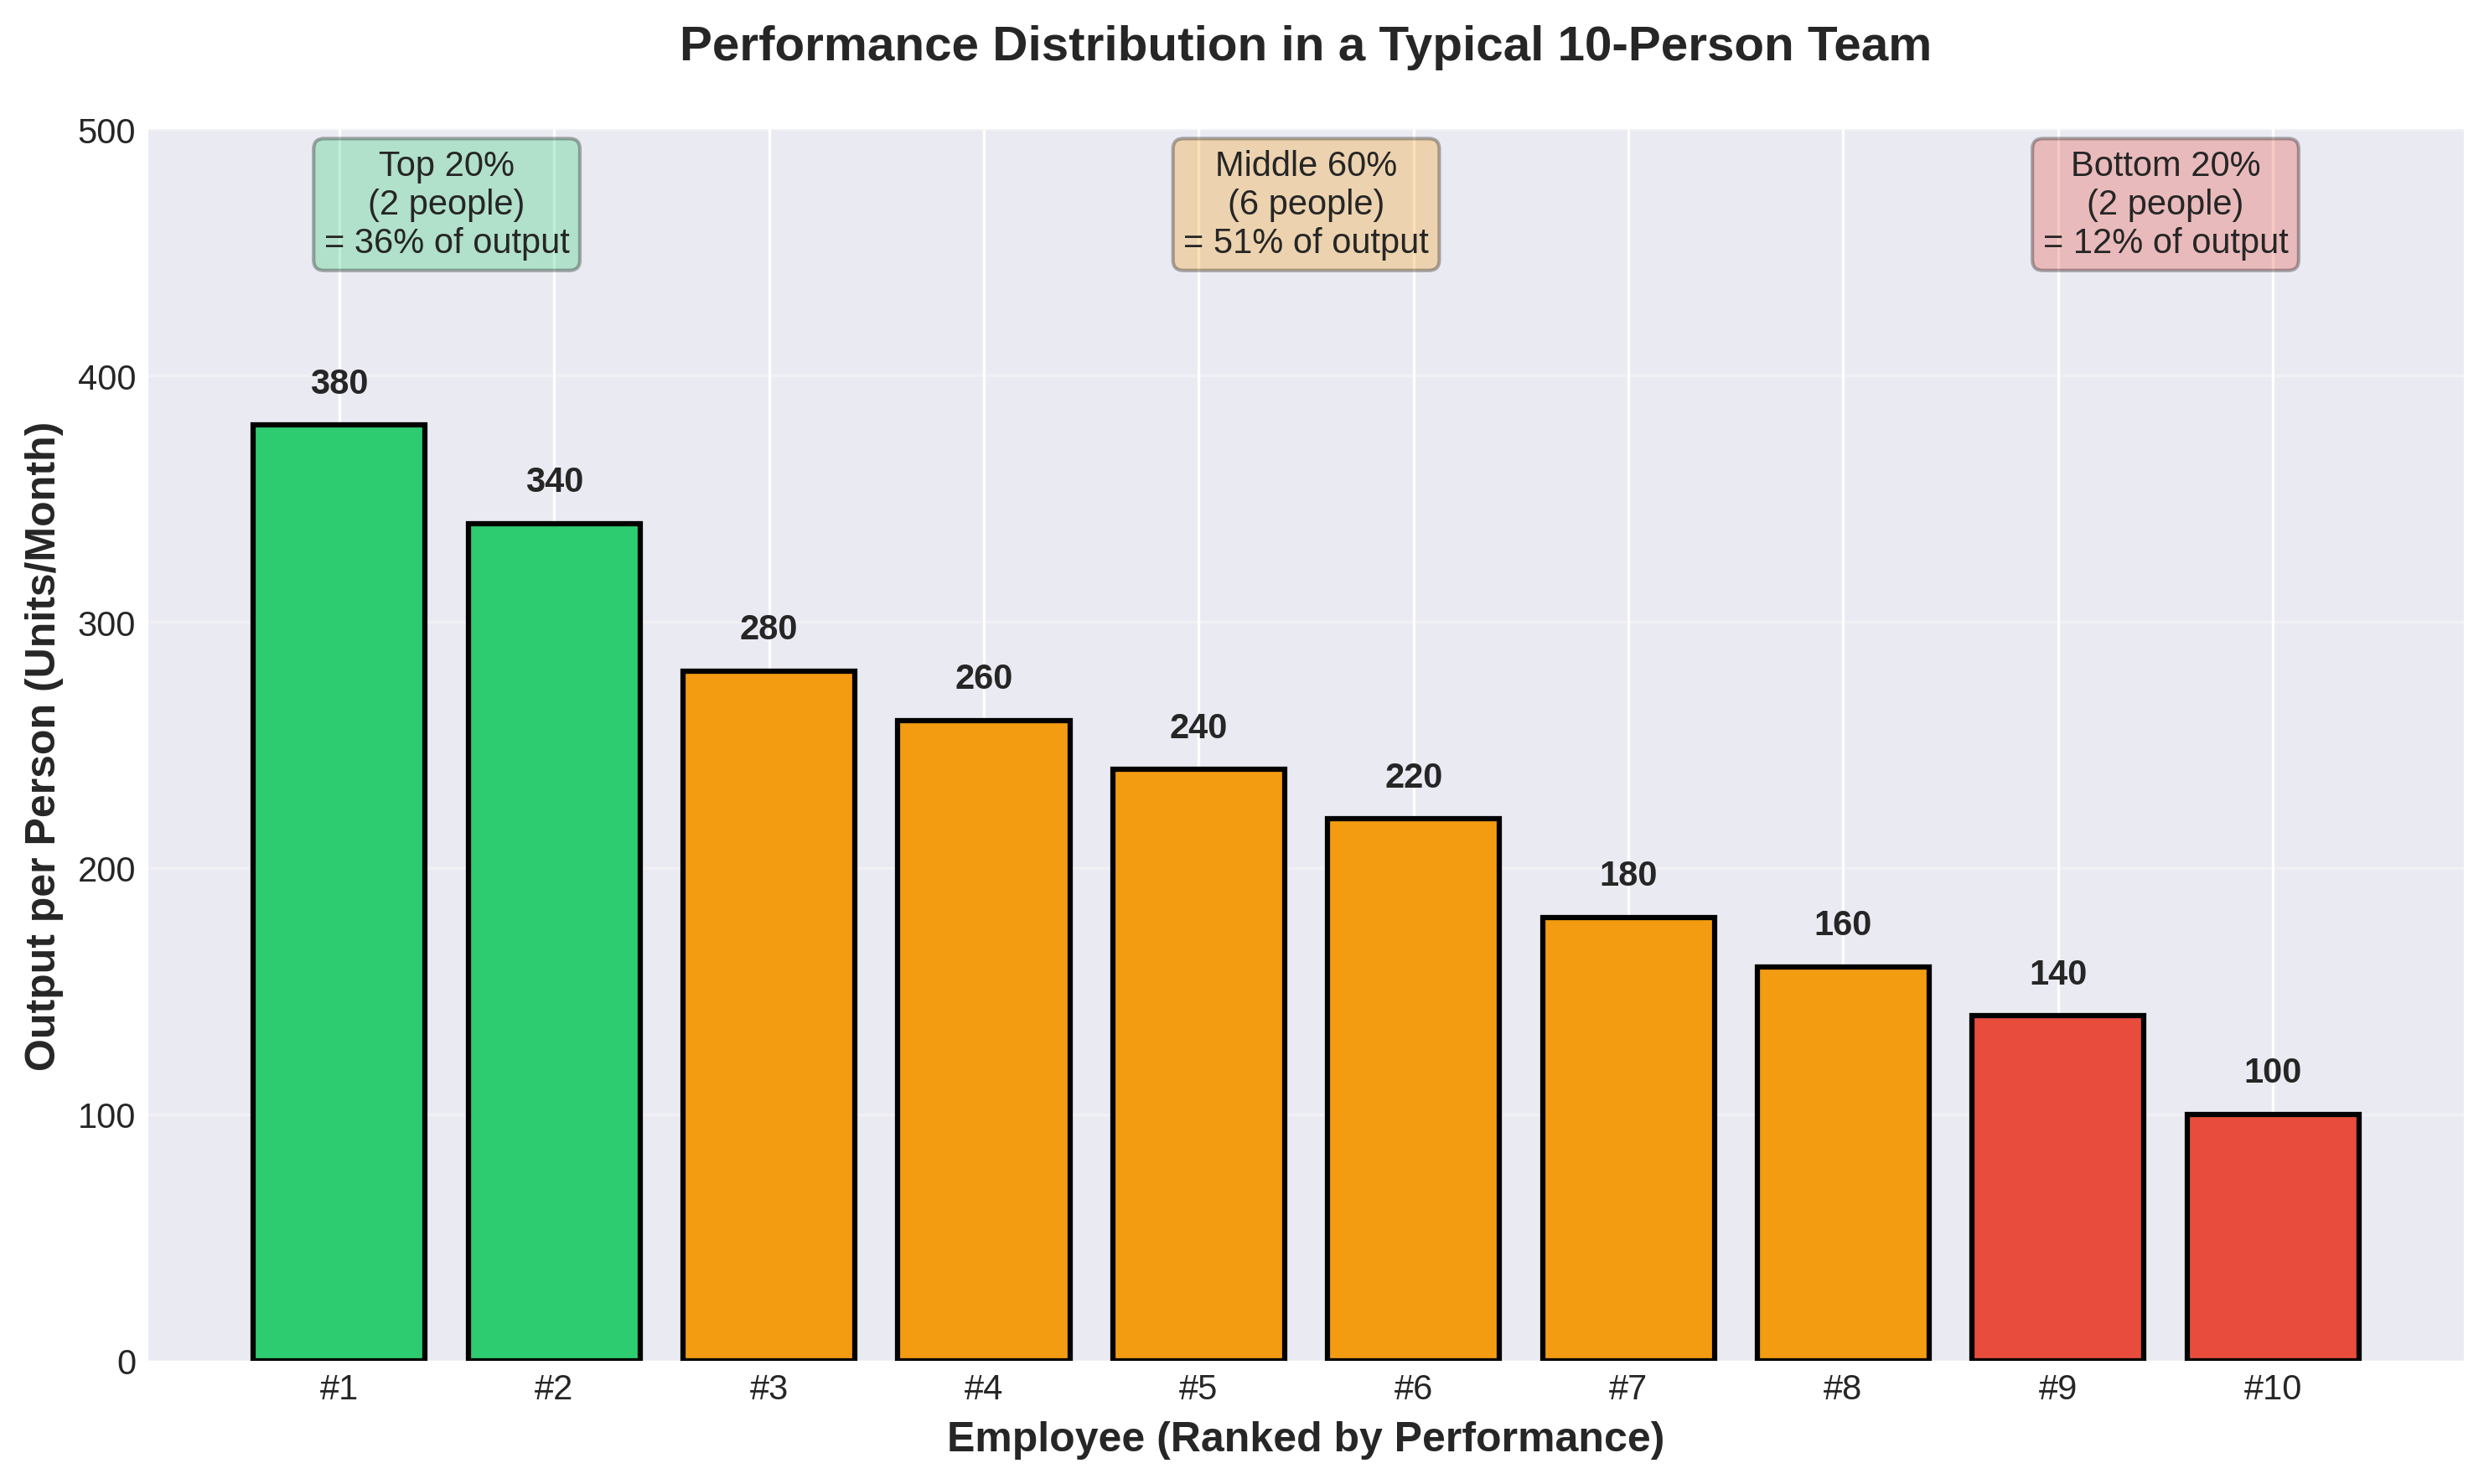
Take a look at this chart showing a typical ten-person team. The two people at the top - just 20% of your headcount - are producing 36% of your total output. Meanwhile, the two people at the bottom are producing just 12% of total output. That’s a three-to-one ratio within a single team, sitting in the same office, working under the same manager, ostensibly doing the same job. And yet in most budget discussions, in most planning exercises, in most compensation decisions, these ten people are treated as if they’re identical line items producing identical value.
Think about what this means in practice. When you’re running the math on whether you can afford to hire someone, you’re probably thinking about average productivity and average compensation. But there is no such thing as an average employee - that’s just a statistical abstraction. What you’re actually choosing between is hiring someone who will be in that top 20%, contributing way above their salary, or hiring someone who will end up in that bottom 20%, consuming disproportionate management time while producing minimal output. The expected value calculation is wildly different depending on which outcome you get, and yet the hiring decision is usually framed as: “Can we afford another $75K in salary?” rather than “Can we afford the risk of adding a low performer, and are we confident we can identify and attract a high performer?”
The Second Dynamic: Coordination Cost Explosion
But here’s where it gets even more interesting, because the productivity variance is only half the story. The second insight embedded in our revised equation is that coordination costs don’t scale linearly with team size - they scale exponentially. Every person you add to a team doesn’t just add their own individual productivity (positive or negative). They also add complexity to the team’s communication structure, and that complexity grows much faster than headcount.
The math here is actually quite elegant:
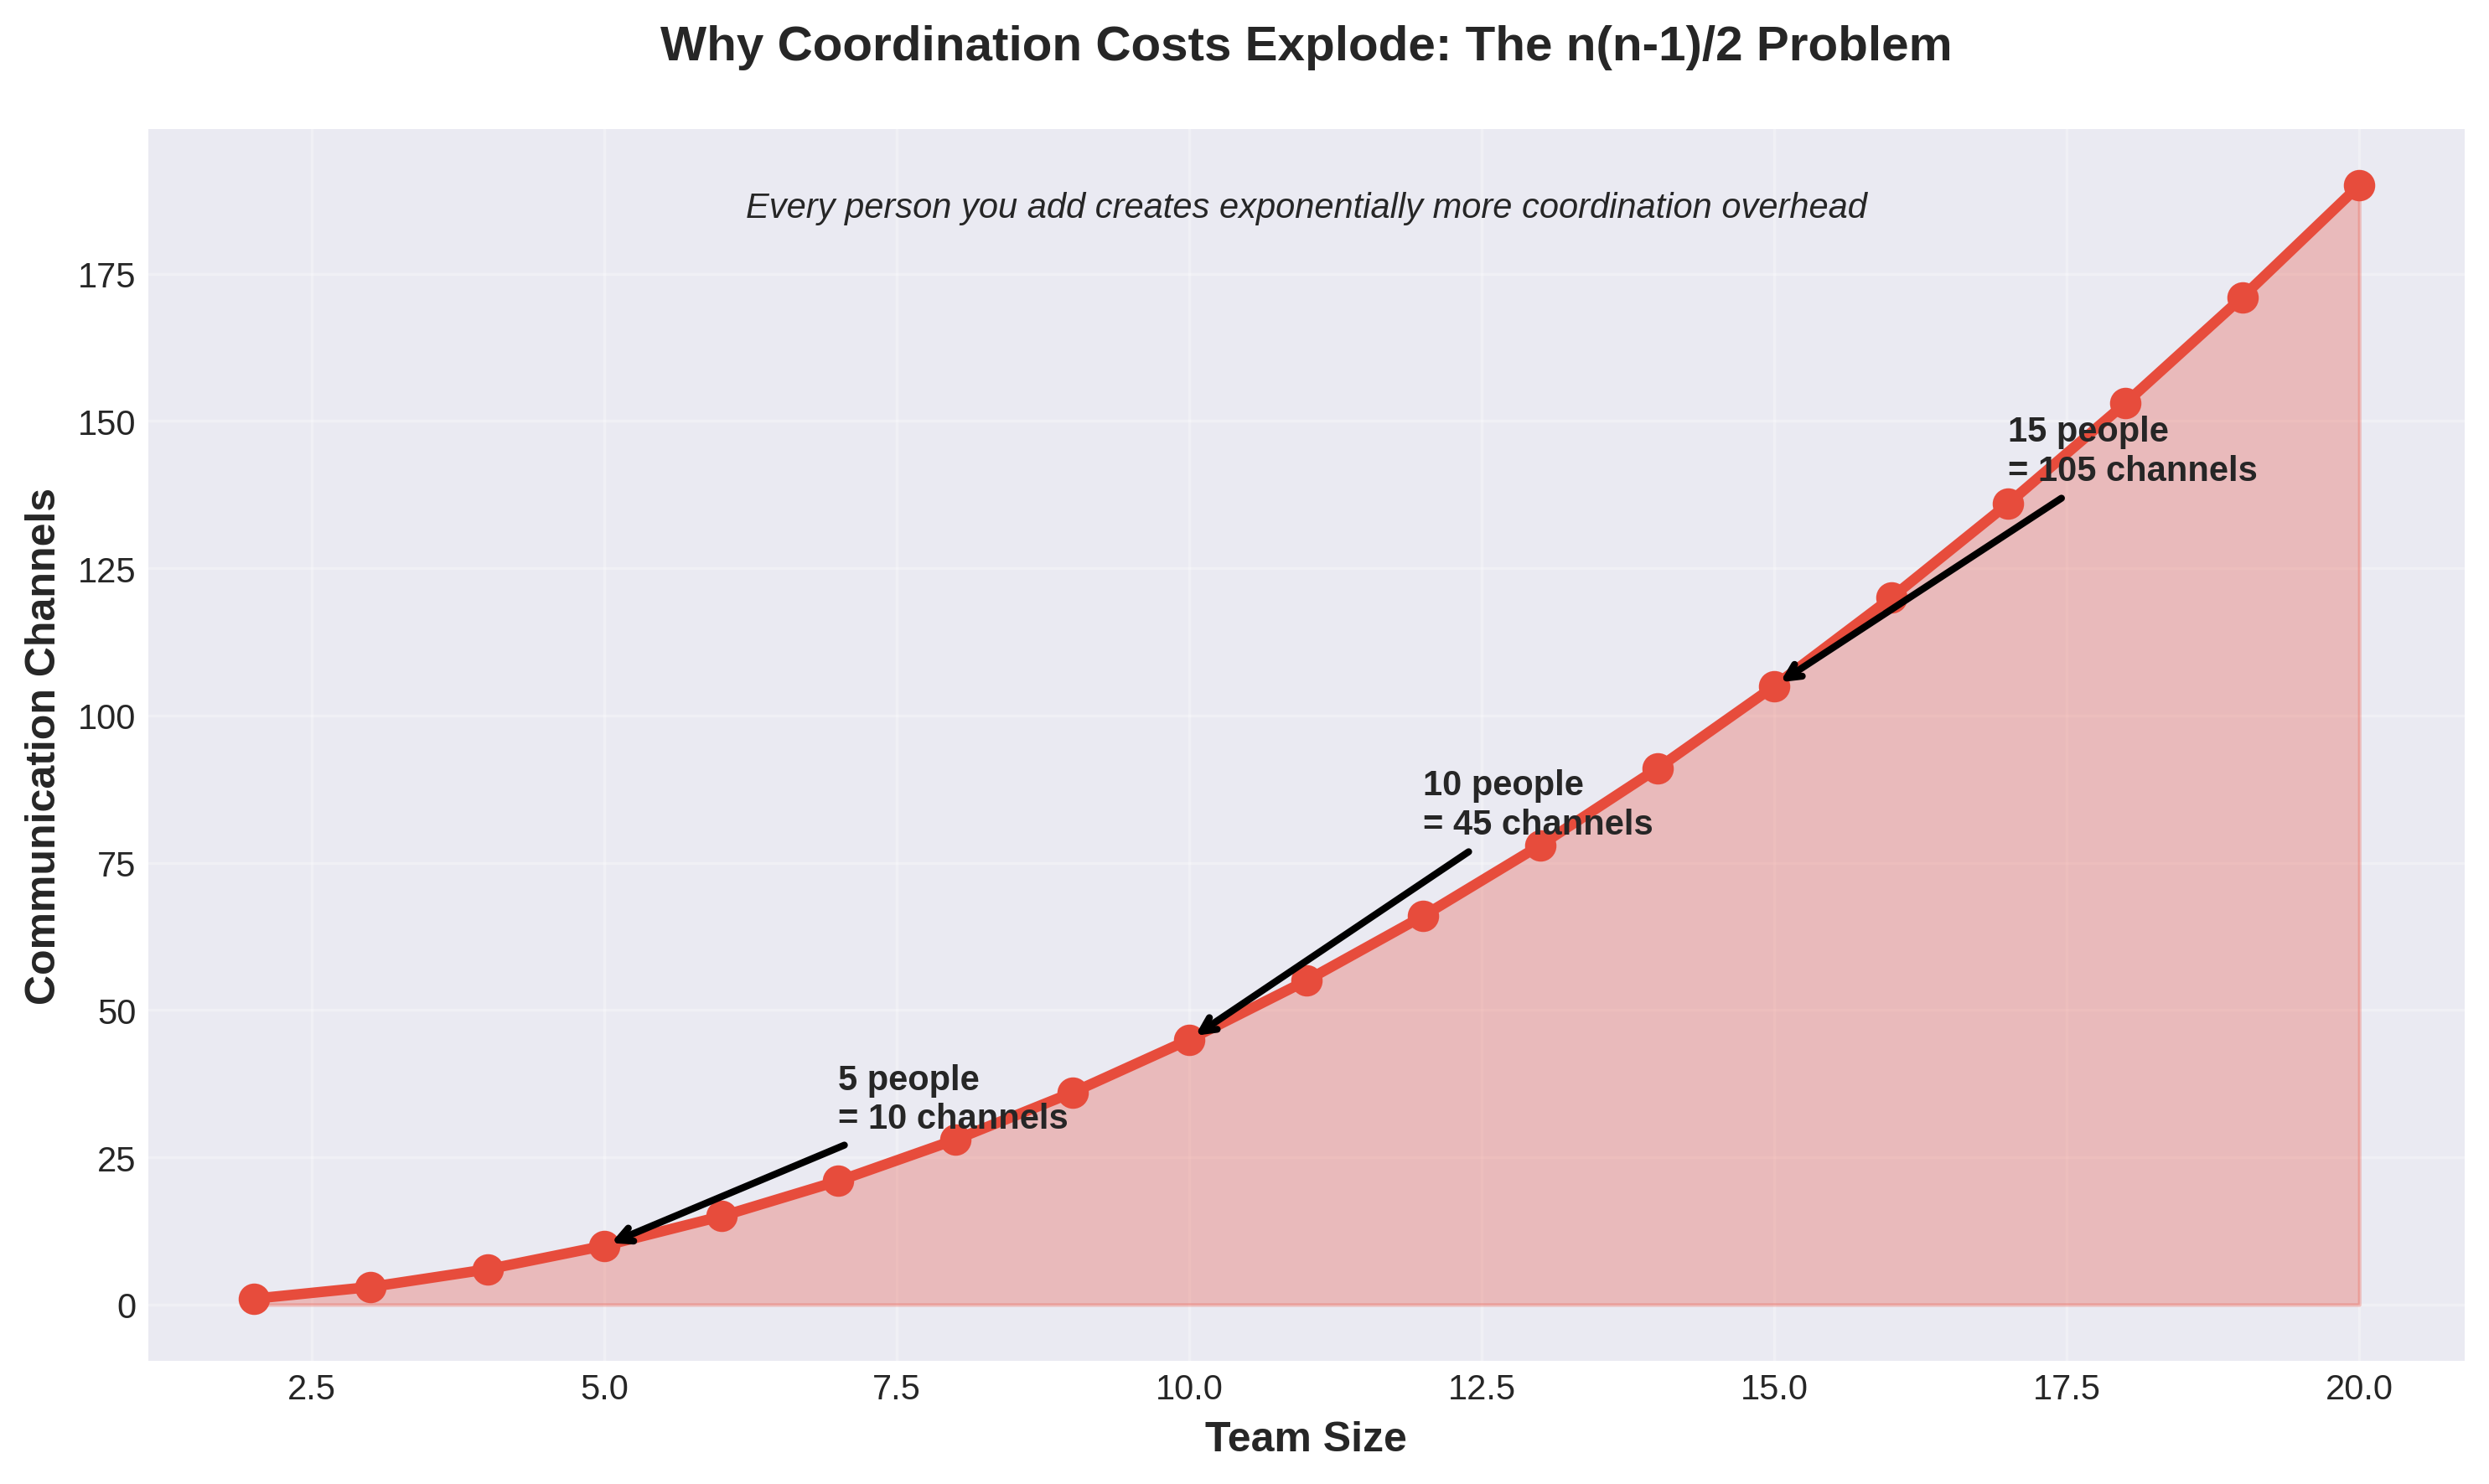
Communication Channels = n(n-1)/2
Where n = number of people on the team
What this means in practice:
5 people = 10 communication channels
10 people = 45 channels (4.5x more, not 2x more)
15 people = 105 channels (10.5x more, not 3x more)
Each additional person you add creates communication channels not just with you as the manager, but with everyone else on the team. The first person you hire creates one channel (between you and them). The second person creates two new channels (with you, and with person one). The third person creates three new channels. The tenth person creates nine new channels. By the time you have fifteen people, you’re maintaining 105 different potential communication channels, compared to just 10 channels with five people.
Now, you might be thinking: “Sure, but we don’t actually communicate through all those channels all the time. Most of those connections are dormant.” And you’d be right - most of those potential channels don’t light up on any given day. But the possibility that they might light up, the need to keep everyone roughly aligned and informed, the risk of important information not reaching someone who needs it - that’s the coordination tax you’re paying. It shows up as meetings that grow to accommodate more participants. It shows up as email threads that sprawl across more inboxes. It shows up as Slack channels where people need to scroll back through dozens of messages to figure out what they missed. It shows up as misunderstandings that lead to rework. It shows up as decisions that take three times longer because more stakeholders need to weigh in.
Every one of these channels represents cognitive overhead - not just for the people directly communicating, but for everyone who needs to maintain awareness of what’s happening across the team. Manager time spent in alignment meetings instead of doing actual strategic work. Project delays because coordinating schedules across twelve people is harder than coordinating across six. Duplicated efforts because person A didn’t know person B was already working on something similar. Quality issues because the handoff between person C and person D involved information loss. These coordination costs are real, they’re expensive, and they grow exponentially rather than linearly.
Here’s the kicker: high performers actually create lower coordination costs than average performers. They need less supervision, less hand-holding, less course correction. They communicate more clearly, so there’s less back-and-forth. They make better judgment calls, so they require less escalation. They produce higher-quality work, so there’s less rework and less cleanup from other team members. The coordination cost of managing a high performer might be two hours a week, while managing an average performer might consume five to eight hours of manager time weekly. That differential compounds across the team.
Putting It Together: The Talent Density Curve
When you combine these two dynamics - massive productivity variance between individuals, plus exponentially growing coordination costs - you get something that looks radically different from the traditional linear model. You get what I call the Talent Density Curve.
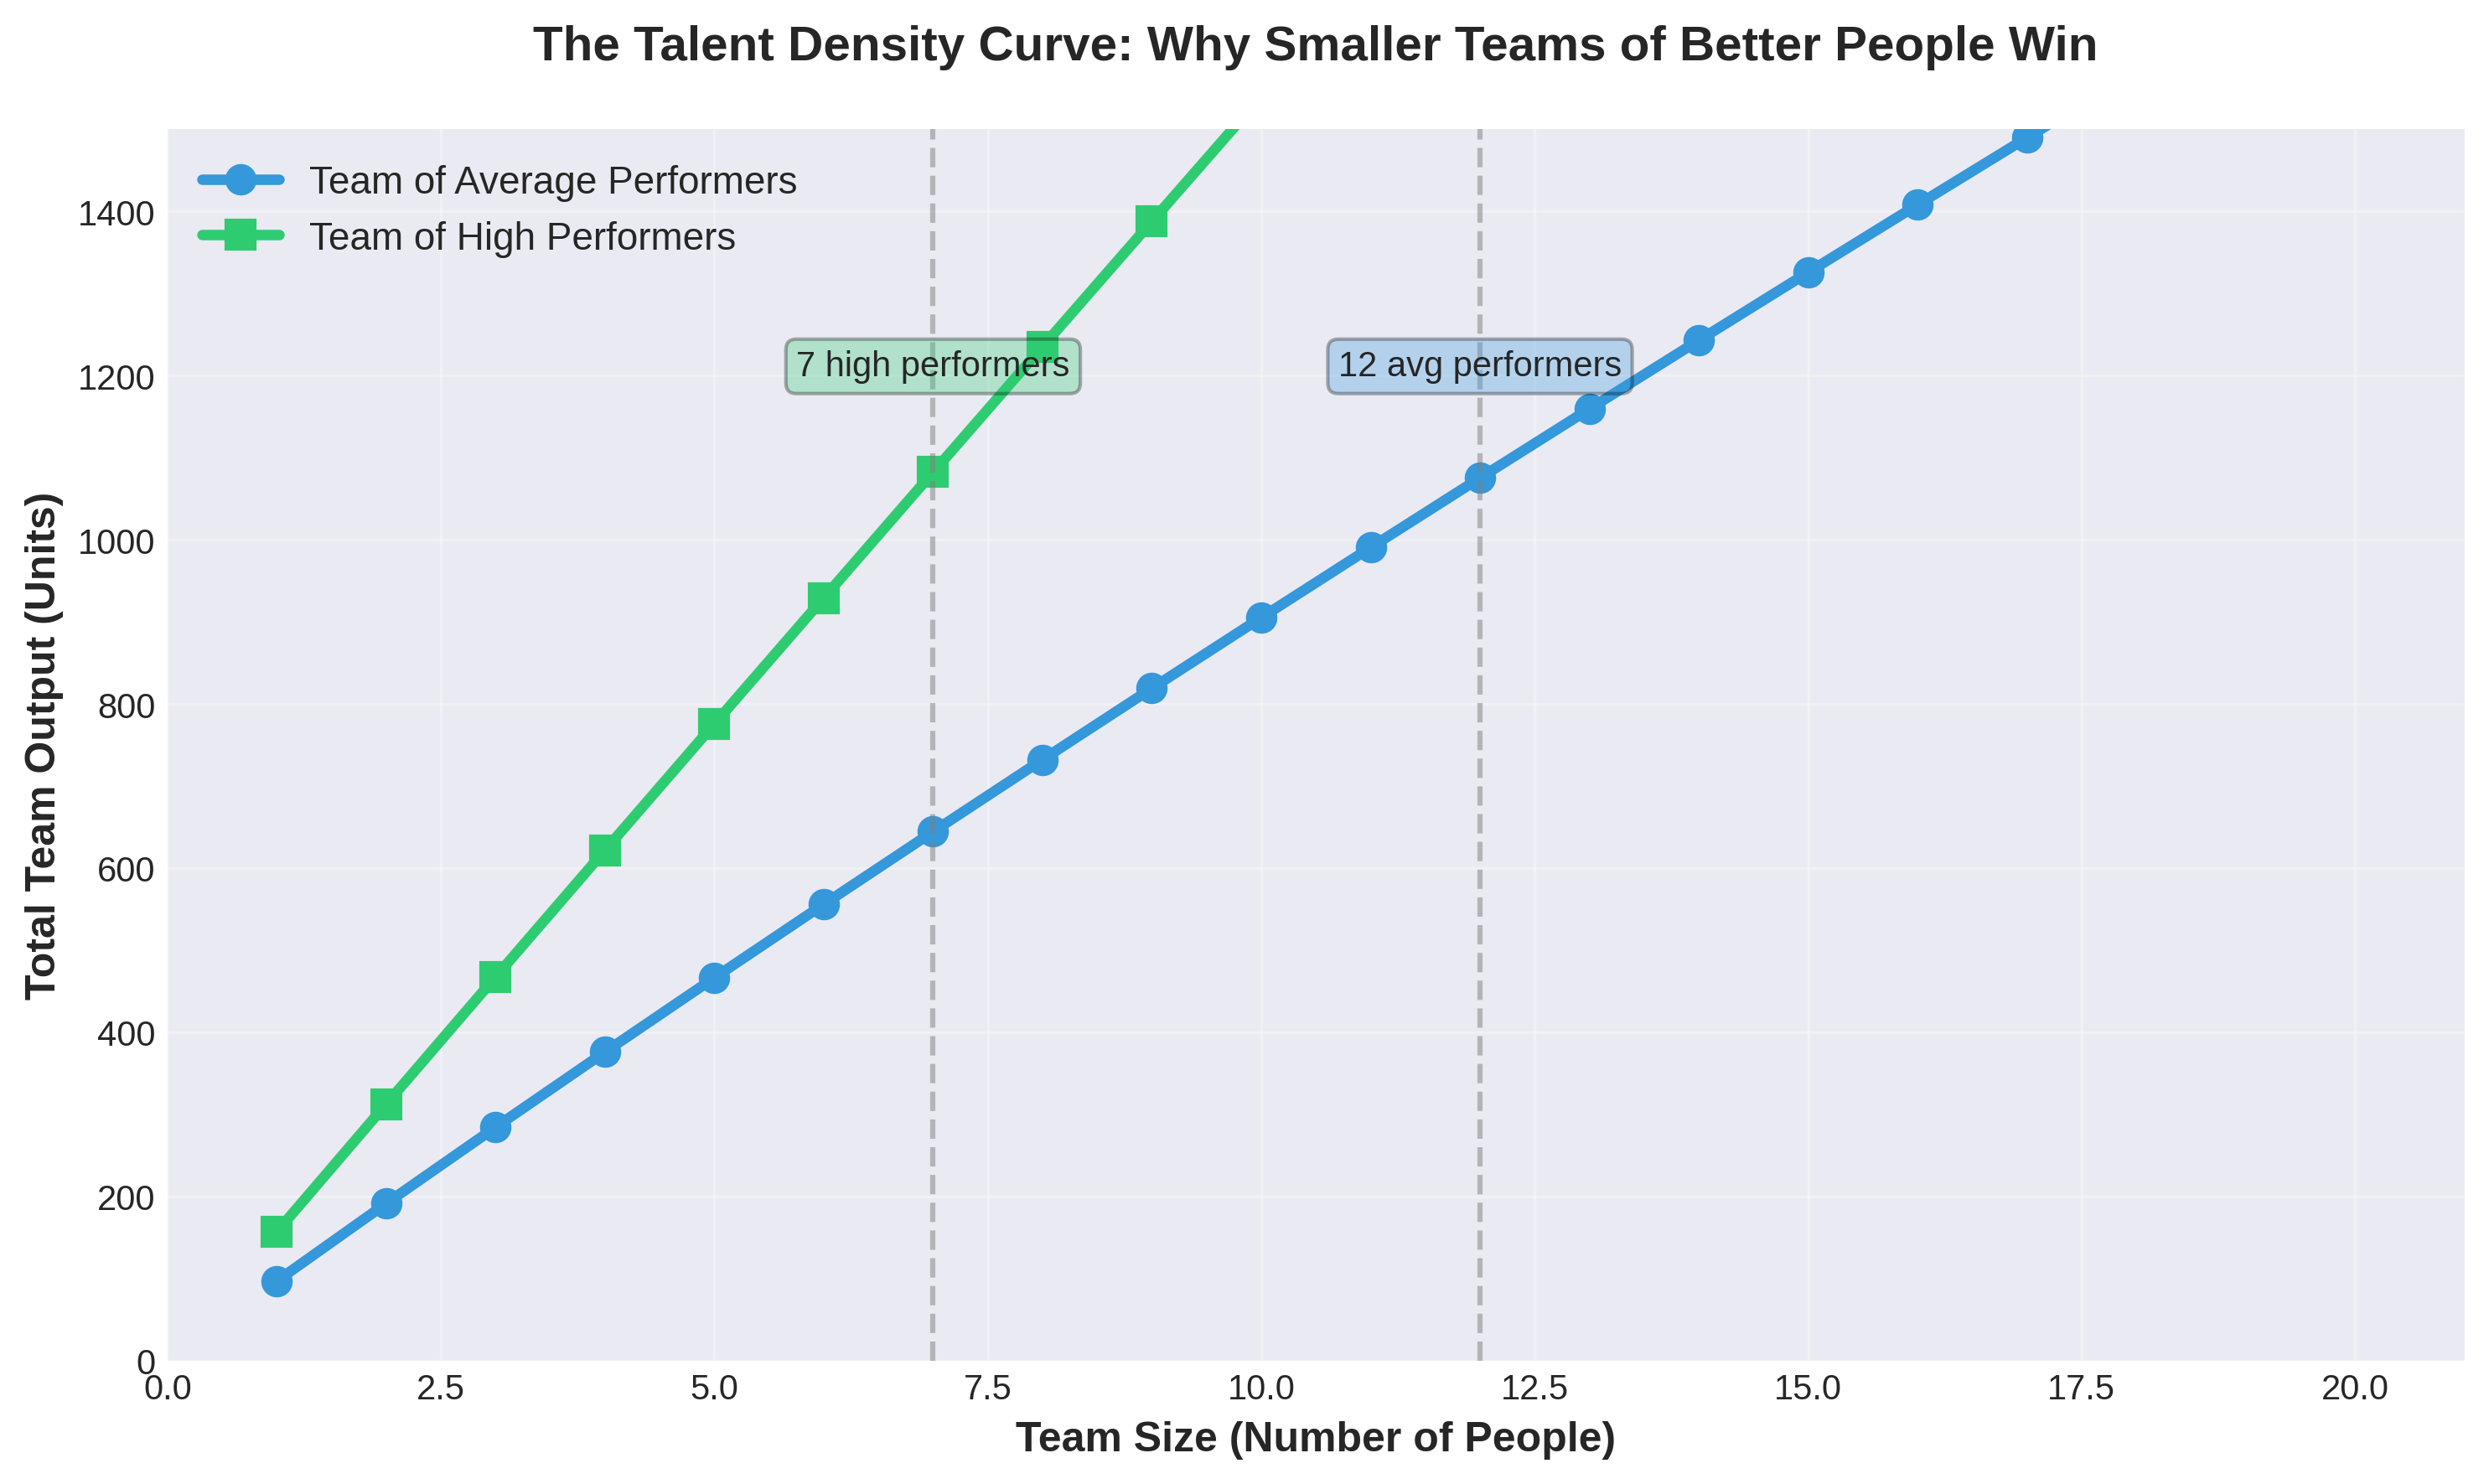
Look at what’s happening in this chart. The blue line represents a team of average performers. Output grows as you add people, which makes intuitive sense. But notice what happens as the team gets larger: the growth rate starts to slow down, eventually reaching a plateau, and in some cases actually starting to decline. That’s the coordination costs overwhelming the productivity gains from additional headcount. You’re adding bodies, but they’re spending so much time coordinating with each other that total output barely budges.
The green line tells a completely different story. This represents a team of high performers - same work, same industry, same basic structure, just better people. The output grows faster per person added, peaks earlier (meaning you need fewer total people to reach maximum output), and sustains at a higher level. Why? Because each individual person produces more, high performers require less coordination overhead, and smaller teams have dramatically lower coordination costs overall.
Here’s the insight that makes this actionable: seven high performers will produce more total output than twelve average performers. Let me say that again because it’s the crux of the entire framework: you can achieve higher total output with 40% fewer people if those people are substantially better. This isn’t theory. This isn’t aspiration. This is math, and it plays out in real organizations every quarter.
The Math: A Real Example
Let me make this concrete with actual numbers, because the abstract concept is interesting but the practical application is what matters. Let’s build out a scenario that mirrors what you might see in a typical mid-sized company - nothing exotic, nothing extreme, just the kind of everyday situation that plays out in budget meetings across the country.
Scenario A: Current State (The Typical Team)
Imagine you’re running a team of ten people. Maybe it’s a sales team, maybe it’s an operations team, maybe it’s customer support - the specifics don’t matter too much because the dynamics are similar across most knowledge work. Your team looks like this on paper:
The headline numbers:
10 people at $75,000 average salary
Total annual compensation: $750,000
Average productivity: 100 units per person per month
Total output: 1,000 units per month
Cost per unit: $750
Seems reasonable. Seems normal. Seems like the kind of numbers that would sail through any budget review.
But now let’s look under the hood at what’s actually happening, because while your ten people average 100 units per month, that average is hiding enormous variance:
The actual distribution:
Top 2 performers (A-players): 150 units each = 300 units total (30% of output)
Middle 6 performers (B-players): 100 units each = 600 units total (60% of output)
Bottom 2 performers (C-players): 50 units each = 100 units total (10% of output)
Now here’s where it gets interesting. Those bottom two people are consuming 20% of your payroll and - if you’re honest with yourself - probably consuming 40% to 50% of your management time. They’re the ones who need constant check-ins, whose work requires review and revision, who create little fires that other people have to put out, who show up in your inbox on weekends with questions that should have been resolved days ago.
This is the reality in most organizations, but it’s hidden because everyone is focused on aggregate numbers - total headcount, total budget, total output. The variance gets averaged away in the spreadsheet, but it’s very real in the day-to-day operation of the team.
Scenario B: The Talent Density Play
Now let’s run a thought experiment. What if you made a different set of choices? Stay with me here because this will feel uncomfortable at first, but watch what happens to the numbers.
The intervention:
Exit bottom 4 performers (40% of team) = $300K freed up
Increase salaries 30% for remaining 6 people ($75K → ~$98K average)
Hire 0 replacements - stay lean, redistribute work
Use savings to pay top performers at 75th-90th percentile ($120K-$130K)
The new team:
6 people at $110,000 average salary
Total annual compensation: $660,000 (12% lower)
Average productivity: 200 units per person (because you only kept/hired A-players)
Total output: 1,200 units per month (20% higher)
Cost per unit: $550 (27% better)
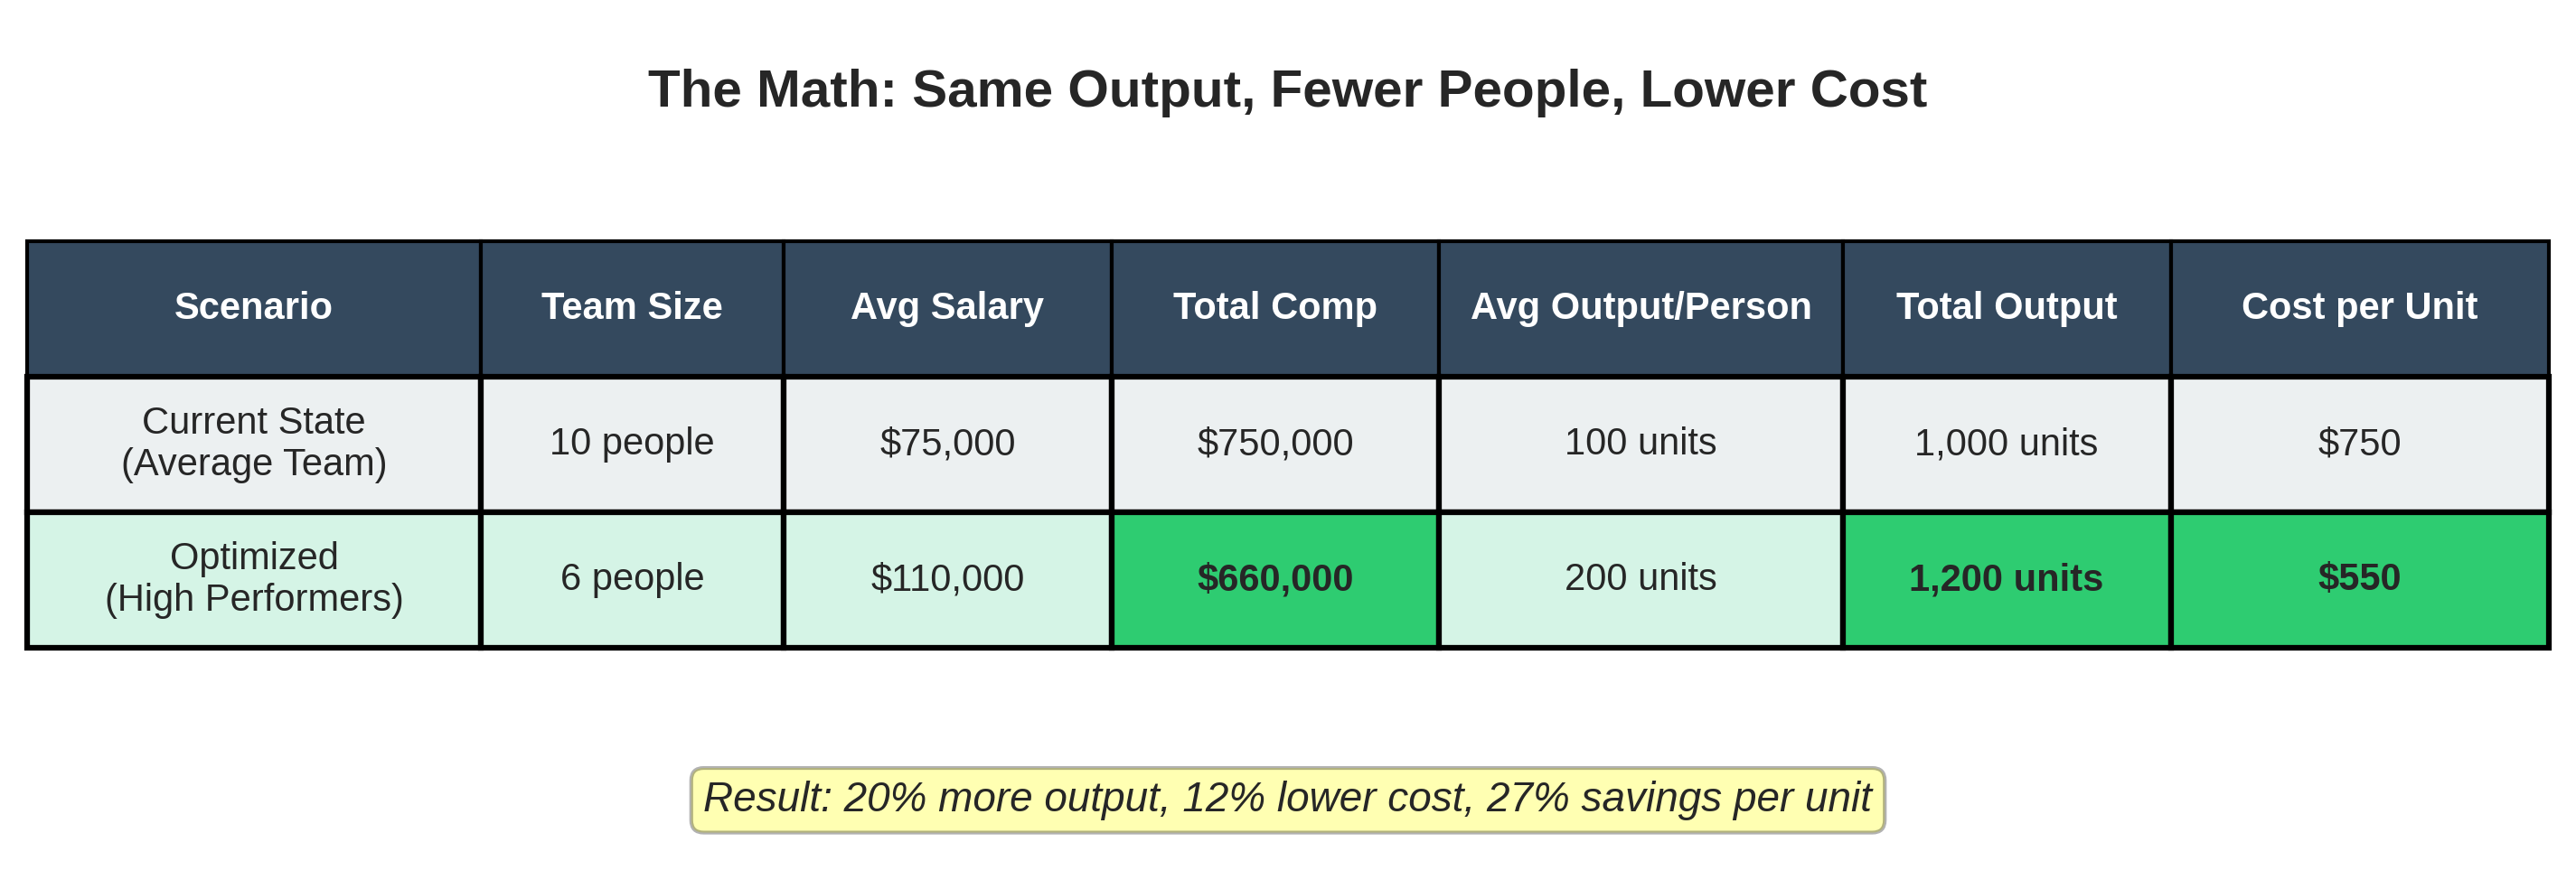
Let me make sure those numbers are crystal clear:
Before: 10 people, $750K compensation, 1,000 units output, $750 cost per unit
After: 6 people, $660K compensation, 1,200 units output, $550 cost per unit
You just increased total output by 20%, decreased total costs by 12%, and improved your cost per unit by 27%. With fewer people.
Why This Works (The Magic Behind the Math)
Now, you might be skeptical. You might be thinking: “This is too good to be true. What’s the catch?” So let me break down exactly why this works, because understanding the mechanism is crucial to believing it’s possible and to replicating it in your own organization.
Five compounding factors make the math work:
1. Dramatically higher individual productivity
You went from a team that included both A-players and C-players (averaging B-level performance) to a team that’s exclusively A-players. By paying 30-40% above median market rates, you’re now hiring from the top 20% of the talent market. Here’s the key insight: the relationship between compensation and talent quality isn’t linear. There’s a convexity to it where paying at the 75th percentile gets you access to talent that’s not just 30-40% better, but 100-200% better in terms of actual output.
2. Massive reduction in coordination costs
Going from 10 people to 6 people means you went from 45 potential communication channels down to just 15. That’s a 67% reduction in coordination complexity. The effects show up everywhere:
Fewer people in every meeting
Faster decisions (less alignment needed)
Less risk of miscommunication
Fewer handoffs where information gets lost
Work flows more smoothly through the system
3. Freed-up management capacity
Remember that bottom performers were consuming disproportionate management time? They’re gone now. The math on manager time typically looks like this:
High performers: ~2 hours per week (one good 1:1, maybe one ad-hoc conversation)
Average performers: 5-8 hours per week
Low performers: 10-15 hours per week (check-ins, corrections, interventions, emotional support)
Your manager just got back somewhere between 12 and 24 hours per week. That time can now go toward strategic work, coaching your best people to get even better, or focusing on actual business problems rather than people problems.
4. Self-reinforcing culture
A-players love working with other A-players. They get energized by being on a high-performing team. They’re more likely to stay because they’re not frustrated by carrying dead weight. They refer their talented friends and former colleagues. Meanwhile, B- and C-players who might apply are more likely to self-select out because they can sense they wouldn’t thrive. The quality bar becomes self-reinforcing rather than constantly eroding.
5. Compound second-order effects
High-performing teams get assigned the most important, interesting work. They execute faster, capturing more opportunities. They build momentum and confidence. Success breeds success. Other teams start emulating their approach. Customers notice the difference in quality and responsiveness. All of these amplify the initial gains.
This is why the Talent Density Multiplier isn’t just an interesting intellectual exercise - it’s a practical framework that creates measurable, sustainable competitive advantage. The companies that figure this out stop being linear-thinking organizations that scale by adding bodies, and become exponential-thinking organizations that scale by getting radically better at attracting, deploying, and retaining exceptional talent.
When This Model Works (And When It Doesn’t)
Like any framework worth its salt, the Talent Density Multiplier has boundary conditions. It’s not universal, it’s not a panacea, and applying it blindly without understanding when it’s appropriate will lead you astray. So let’s be rigorous about understanding where this model shines and where it breaks down. The difference between a useful framework and dangerous oversimplification is knowing the limits.
✅ This Model Works When...
1. Productivity variance is high (>2x between top and bottom performers)
If your best person produces only 20-30% more than your worst person, talent density won’t move the needle much. The juice isn’t worth the squeeze. But in most knowledge work, consulting, sales, operations, and skilled trades, variance is substantial - typically 2-5x, sometimes even higher.
The test is simple: measure output per person for 90 days across your team. If you don’t see meaningful variance, then your bottleneck isn’t talent quality - it’s probably process, systems, or resources. Fix those first. But if you do see that 2x+ spread between top and bottom performers, you’re sitting on a talent density opportunity.
2. Work is redistributable among fewer people
Some work genuinely requires N bodies in N places doing N things simultaneously. If you’re running a 24/7 customer support operation with fixed call volume, you need enough people to cover all shifts regardless of individual productivity. If you’re operating a retail store that needs someone at the register during all business hours, you can’t just have fewer, better people - you need bodies in seats when customers show up.
But here’s what most managers miss: a lot of work that seems like it requires fixed headcount actually doesn’t. Work expands to fill available people (Parkinson’s Law). Projects get staffed based on who’s available rather than who’s needed. Tasks get distributed evenly rather than optimally. Challenge the assumption. Run a 90-day experiment with one team operating 20% leaner and see if they can maintain output through better prioritization, elimination of low-value work, and process improvement.
3. You can attract better talent at premium compensation
If you’re in a market where all available talent looks roughly the same regardless of what you pay, this model struggles. But this is rarer than people think. In most markets, paying at the 75th-90th percentile instead of the 50th percentile dramatically improves who applies and who accepts your offers.
The test: post your next job opening at 30% above your current salary range. See who applies compared to your normal postings. If the candidate quality jumps noticeably, the talent elasticity to compensation is there. If it doesn’t, you might have an employer brand problem to solve first, or you’re in a genuinely constrained labor market.
4. Coordination costs are significant
In truly parallelizable work where people operate independently with minimal interdependencies, coordination costs are negligible. Think assembly line work where each station is independent, or field sales where reps work their territories alone. In these contexts, adding people really does scale linearly.
But most modern work isn’t like this. If more than 30-40% of your team’s time goes to meetings, emails, alignment discussions, and coordinating handoffs, coordination costs are material and the talent density model applies.
❌ This Model Breaks When...
1. Commodity labor with minimal productivity variance
If performance variance is genuinely <20% between workers - maybe because the work is highly standardized, machine-paced, or process-constrained - then focus on systems and process improvement, not talent density. The upside from upgrading people is limited.
2. Scale itself is the competitive advantage
Call centers where service level agreements require specific response times, fulfillment centers where volume throughput matters more than per-person efficiency, restaurants during rush periods where you need bodies to cover stations - sometimes you just need headcount, and the coordination cost is worth paying for the coverage.
3. You literally can’t find better talent
In some very specialized fields or severely constrained geographies, the talent pool might be so thin that paying more doesn’t get you better people - everyone available is roughly equivalent. Then you need to solve for training systems, better tools, or potentially relocation/remote work policies.
4. Regulatory or union constraints limit flexibility
Healthcare settings with mandated patient-to-nurse ratios, education systems with class size requirements, union environments with seniority-based rules - if you o
perate under regulatory or contractual constraints that prescribe specific headcount levels, you may not have flexibility to optimize talent density. You’ll need to work within those constraints or change the constraints themselves.
The Decision Framework: When to Upgrade vs. Expand
Here’s a simple flowchart to help you make the call in real time when someone says “we need more people”:
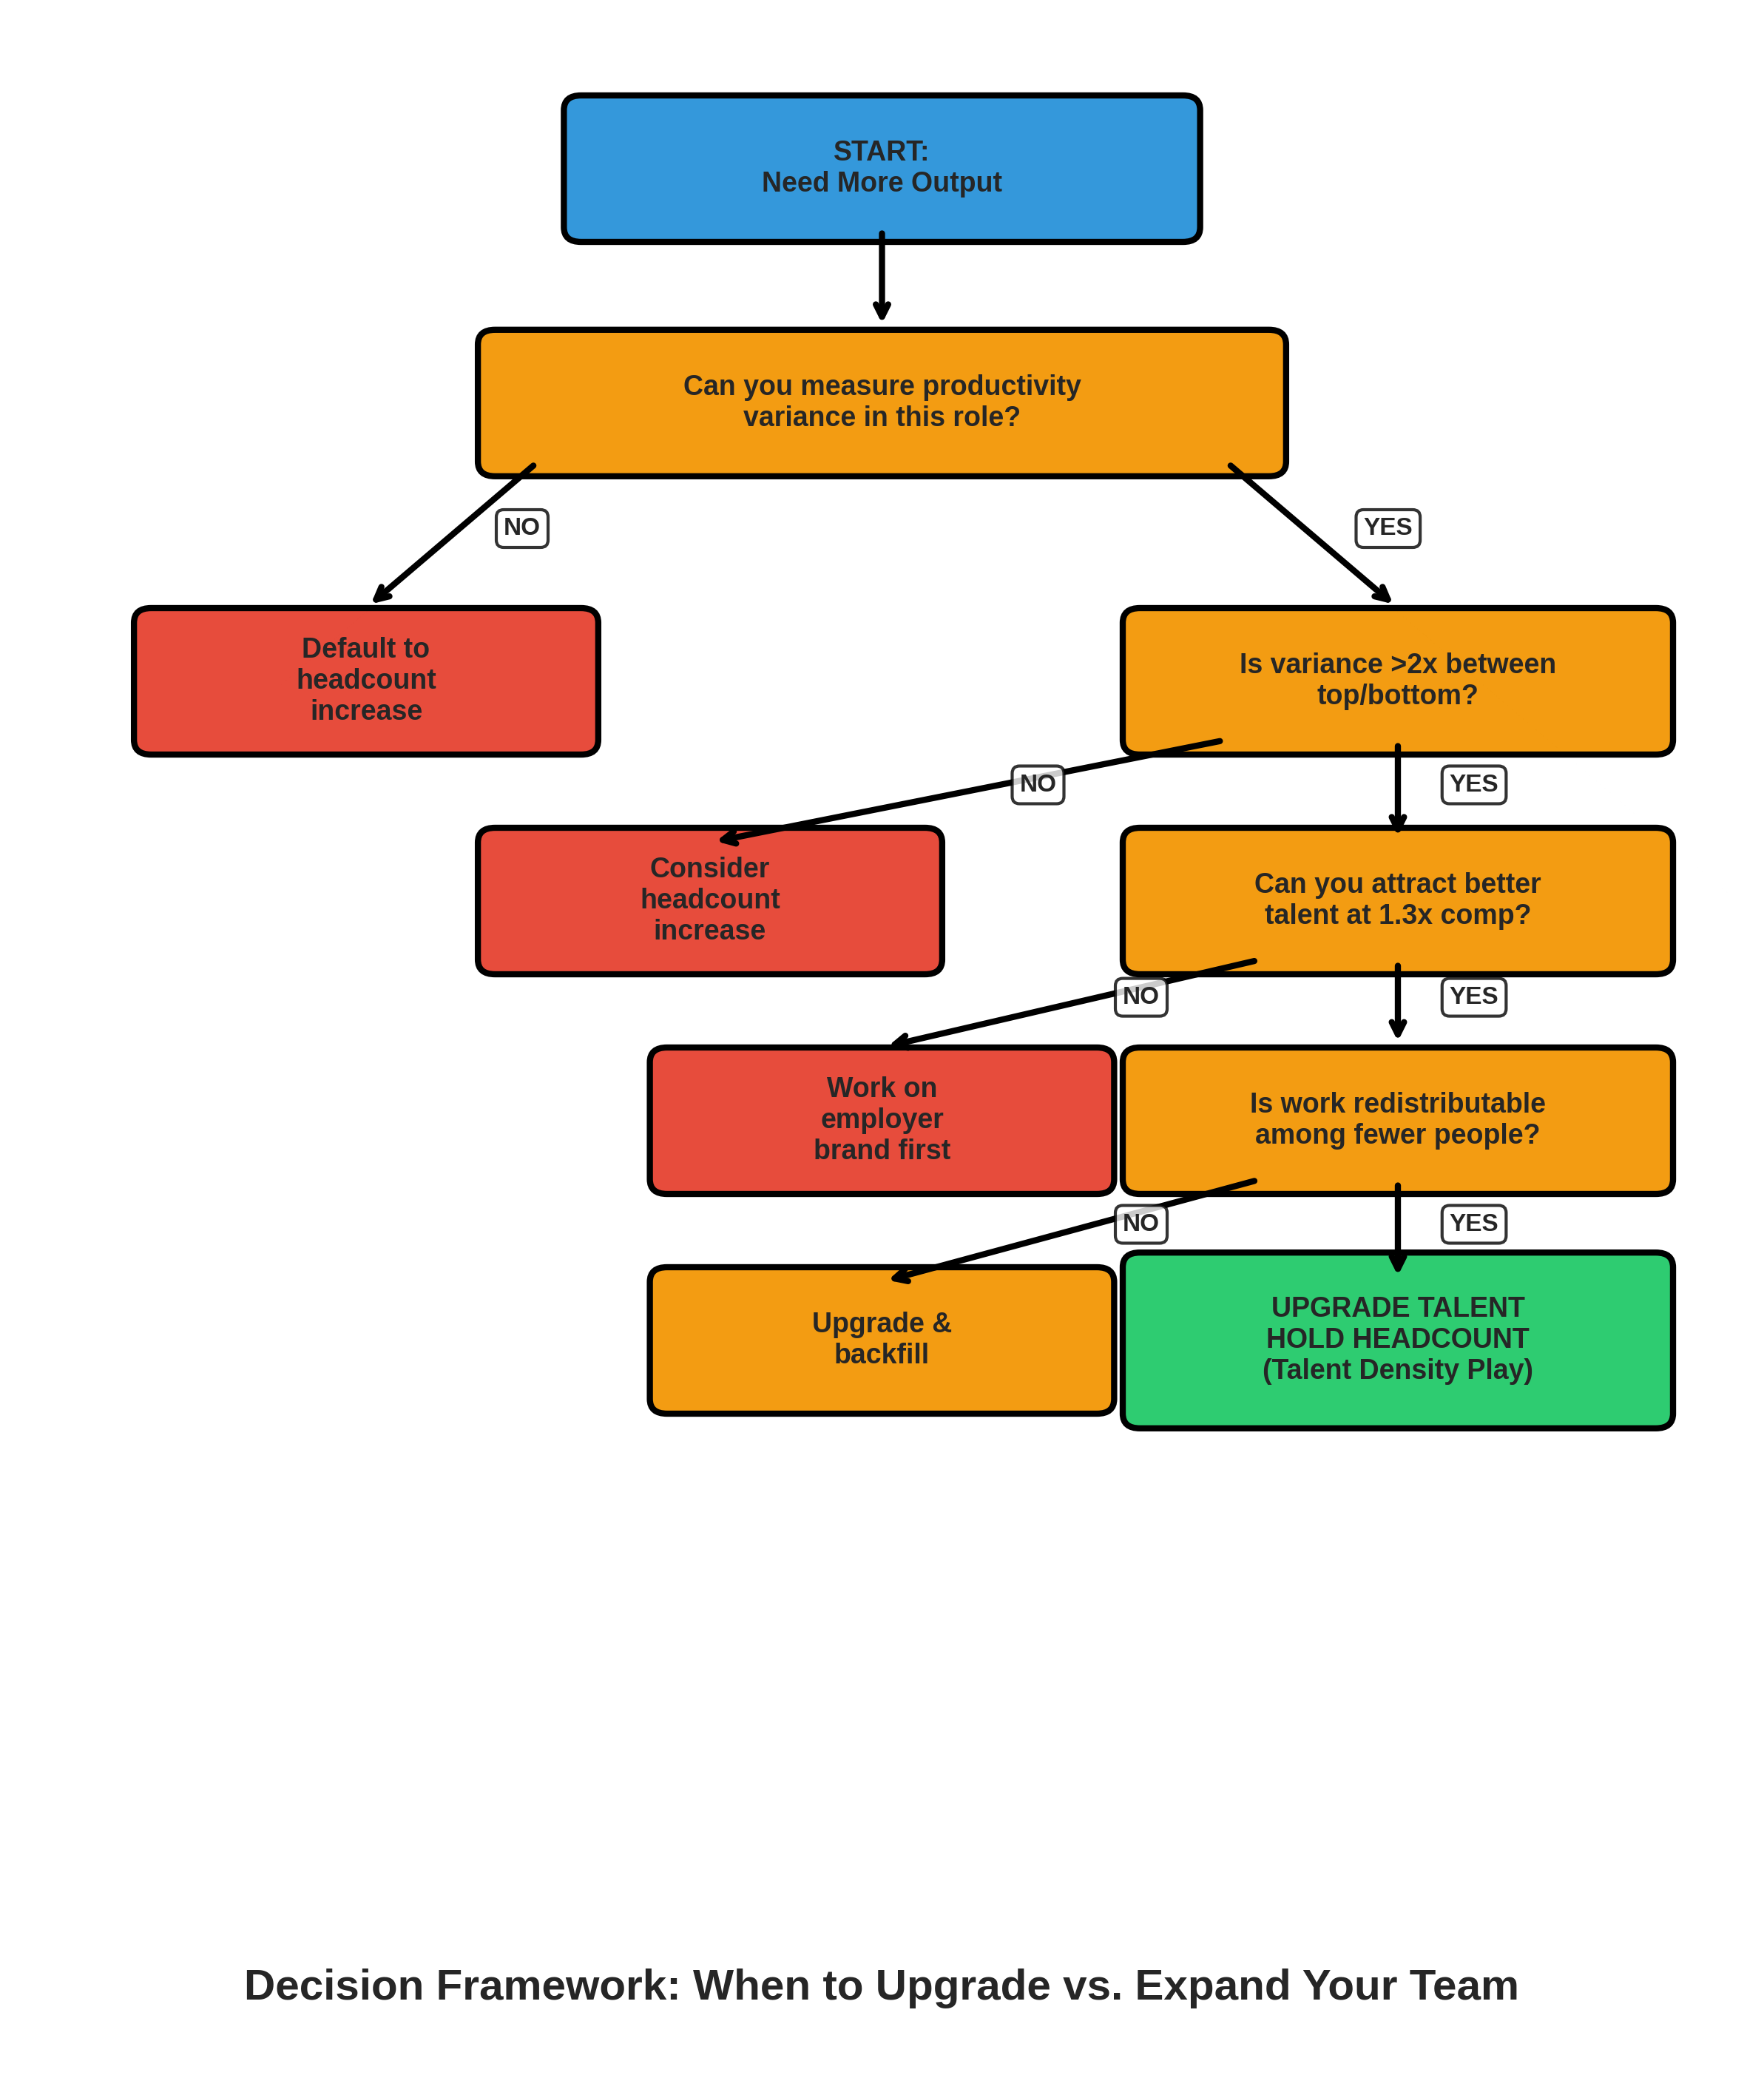
The key questions to ask in sequence:
Q1: Can you measure productivity variance in this role?
• If NO → You need better measurement systems before you can optimize talent density
• If YES → Proceed to Q2
Q2: Is productivity variance >2x between top and bottom performers?
• If NO → Your bottleneck isn’t talent quality, it’s probably process or resources
• If YES → Proceed to Q3
Q3: Can you attract better talent at 20-30% higher compensation?
• If NO → Work on employer brand or consider remote hiring to expand talent pool
• If YES → Proceed to Q4
Q4: Is work redistributable among fewer people?
• If NO → You may need to backfill, but upgrade the quality bar
• If YES → This is a talent density opportunity
The outcome:
If you answered YES to all four questions → Upgrade talent, hold or reduce headcount
This is your highest ROI move. Exit low performers, pay the savings to attract and retain high performers, accept being leaner.
If you answered NO to any question → Address the blocker first
Don’t force talent density into contexts where it doesn’t apply. Fix the measurement system, improve the process, strengthen the employer brand, or acknowledge that this particular role requires specific headcount levels.
Common Misapplications (Don’t Do These)
Smart frameworks get misused. Here’s how people typically get talent density wrong, and what to do instead:
❌ Mistake #1: “Let’s fire everyone below average”
Why this is wrong: You’ll always have a bottom 50% - that’s how averages work. The model isn’t about eliminating variance, it’s about optimizing the distribution toward the high end.
✅ Do this instead: Target the bottom 10-20% who are genuinely underperforming market norms, not just your team’s average. There’s a difference between “below average for our team” and “below acceptable performance standards.”
❌ Mistake #2: “We’ll just pay everyone more and expect higher productivity”
Why this is wrong: Compensation attracts better talent in the hiring process. It doesn’t magically improve existing employees who are already maxed out.
✅ Do this instead: Use increased compensation to hire better replacements when you have turnover or when you’re adding new roles. Don’t just sprinkle raises across your existing team and hope for improvement.
❌ Mistake #3: “Smaller teams are always better”
Why this is wrong: The model doesn’t say “fewer people is always better.” It says “optimize for output per dollar, accounting for coordination costs.” Sometimes the optimal team size is actually larger if work is truly parallelizable.
✅ Do this instead: Run the math for your specific context. What’s the output curve look like? Where do coordination costs start to overwhelm productivity gains? The answer is different for every team.
❌ Mistake #4: “This is just an excuse to cut costs”
Why this is wrong: If your only goal is cutting costs, you’re missing the point entirely. Talent density is about maximizing output per dollar, not minimizing dollars spent.
✅ Do this instead: Focus on output improvements first. Show that you can maintain or increase output with fewer people. Cost savings are the happy byproduct, not the primary goal.
❌ Mistake #5: “We can skip the generous severance part to save money”
Why this is wrong: How you exit people determines whether your remaining employees trust you. Cheap severance destroys culture, creates fear, and triggers your best people to leave.
✅ Do this instead: Budget 6-8 weeks of severance per year of service. Yes, it’s expensive. Yes, it’s necessary. Think of it as the cost of maintaining trust with your high performers.
❌ Mistake #6: “We’ll just copy Netflix’s culture”
Why this is wrong: Netflix pays top-of-market Silicon Valley engineering salaries to compete for Stanford CS grads. You’re probably not in that market. Their specific implementation won’t transfer.
✅ Do this instead: Adopt the principle (fewer, better people paid above-market), but adapt the implementation to your industry, geography, and role requirements. Your “A-player” looks different than Netflix’s “A-player.”
The Compounding Advantage Nobody Talks About
Here’s where talent density becomes truly powerful. It compounds in ways that other advantages don’t:
Year 1: You optimize one team. Output improves 30%, costs decline 15%. Nice win, but not transformational yet.
Year 2: Those margin improvements fund additional investment. You use the savings to upgrade talent in other parts of the organization. Your best people start recruiting their best former colleagues. Word spreads that you’re a place where great people work with great people.
Year 3: You’re now known in your industry as one of the places where top talent wants to work. Recruiting gets dramatically easier. You can be even more selective. Your talent bar rises again. Retention of your best people improves because they love working with other exceptional people.
Year 4: Your culture is self-reinforcing. Mediocre performers self-select out because they can sense they won’t thrive. Great people stay for entire careers because they can’t find better teams elsewhere. You rarely lose people to competitors anymore.
Year 5-10: You have a compounding talent advantage that’s almost impossible for competitors to replicate. They can copy your product. They can copy your strategy. They can copy your processes. But they can’t quickly build the talent density and culture that took you a decade to compound.
This is what separated Intel from competitors in the 1980s and 90s. Google from other search engines in the 2000s. Pixar from other animation studios. McKinsey from other consulting firms. They had strategy and technology advantages, sure. But the sustainable moat was talent density - consistently attracting, retaining, and deploying better people than competitors, and building cultures where excellence was self-reinforcing rather than constantly eroding.
And here’s the kicker: this advantage is mostly invisible from the outside. Competitors can’t easily copy it because they can’t easily see it. It’s not a product feature you can reverse engineer or a process you can benchmark. It’s embedded in the day-to-day reality of who you hire, who you keep, how you develop people, and how ruthless you are about maintaining the bar.
Your Takeaway: The One Thing to Remember
If you forget everything else from this framework, remember this:
Organizational output is a non-linear function of workforce quality and size. Coordination costs grow quadratically (n²) while productivity improvements scale linearly. This makes smaller teams of higher-quality people often more productive and more cost-effective than larger teams of average performers.
Or, if you want the even more compressed version:
Fewer, better people > more, average people.
The math works. The operational evidence is overwhelming. The strategic advantage is real and sustainable.
And yet most organizations never do this because it requires short-term courage for long-term gain:
Courage to exit people who are “fine but not great”
Courage to resist empire building and status games
Courage to pay significantly above market to attract top talent
Courage to stay lean when everyone’s instinct is to hire
Courage to endure short-term productivity dips during transition
Courage to be honest about performance variance
The companies that figure this out - that actually build talent density into their operating model and culture - create compounding competitive advantages that show up in every business metric that matters:
✓ Higher margins that fund more investment
✓ Faster innovation and execution
✓ Better customer satisfaction and retention
✓ Lower employee turnover of top performers
✓ Stronger, self-reinforcing culture
✓ Better stock performance over long time horizons
This isn’t theory. This isn’t aspiration. This is documented, measurable, repeatable. The framework gives you the language to articulate it, the math to prove it, and the implementation steps to do it.
Now go apply it.
What a weird and wonderful world,